
How to Analyze VPC Flow Logs with Amazon Athena and Visualize with QuickSight
Introduction
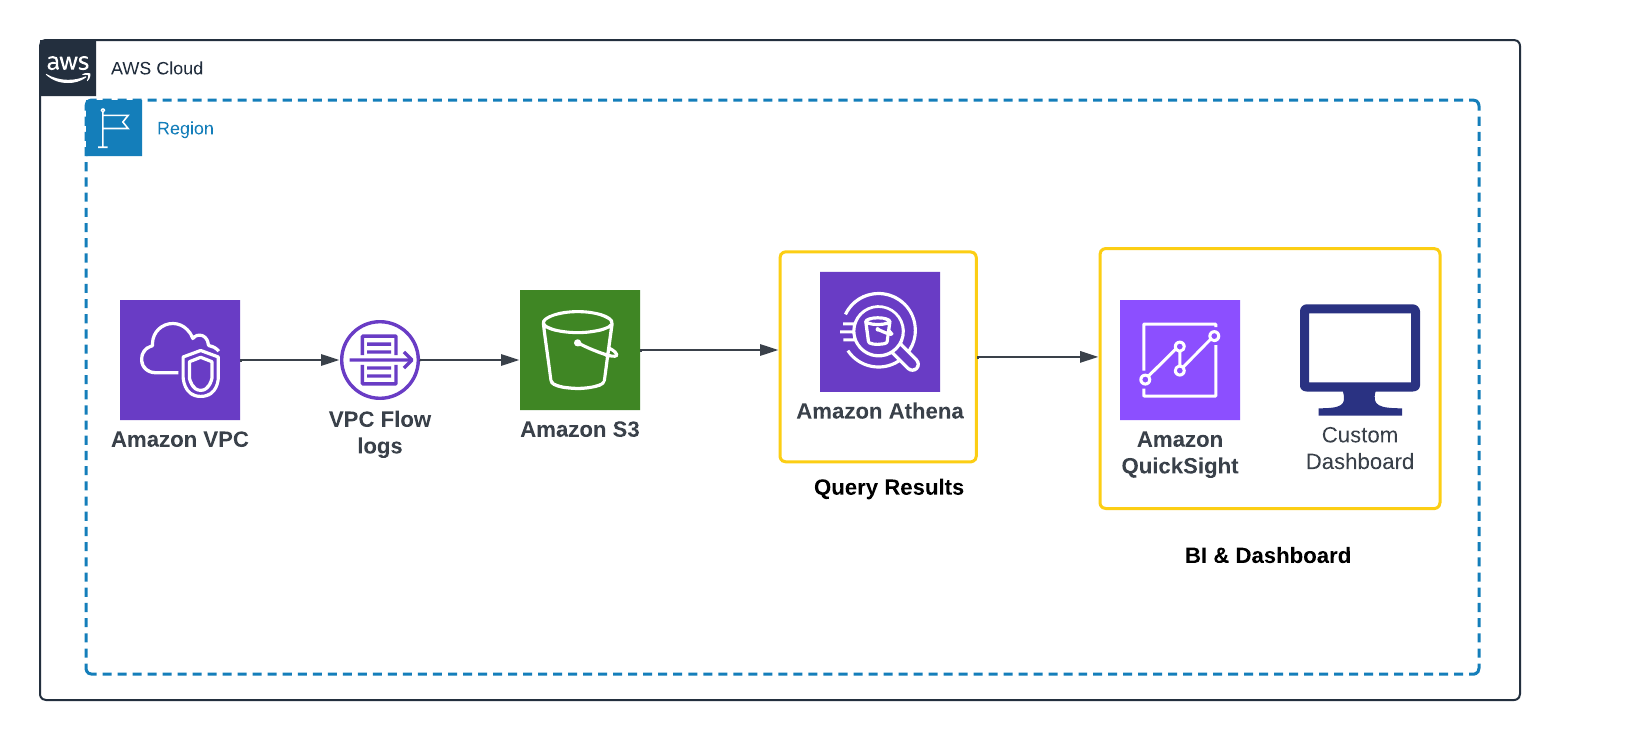
Understanding traffic inside your AWS VPC is critical for security, troubleshooting, and optimization. VPC Flow Logs capture detailed network activity, but in their raw form they are hard to analyze. With Amazon Athena, you can query these logs directly in S3 using SQL. Combined with Amazon QuickSight, you can then build dashboards that make traffic patterns and anomalies easy to visualize. In this guide, we’ll walk through the full process of enabling VPC Flow Logs, querying them with Athena, and creating interactive dashboards in QuickSight.
What is VPC Flow Logs and Why Analyze it?
VPC Flow Logs is an AWS feature that captures detailed information about the IP traffic going to and from network interfaces within your VPC. Each log record includes metadata such as source and destination IP addresses, ports, protocols, number of packets, bytes transferred, and whether the traffic was accepted or rejected.
Analyzing VPC Flow Logs is important because it helps you:
- Improve security: detect unusual traffic, port scans, or unauthorized access attempts.
- Troubleshoot networking issues: identify dropped connections or misconfigured security groups.
- Optimize performance and costs: understand traffic flows and bandwidth usage.
- Maintain compliance: provide audit trails of network activity.
Instead of scrolling through millions of raw log lines, you can use Athena to query them efficiently and QuickSight to visualize patterns in a dashboard.
What is Amazon Athena?
Amazon Athena is a serverless query service that lets you analyze data stored in Amazon S3 using standard SQL. With Athena, you don’t need to manage infrastructure, you simply define a schema for your logs and run queries on demand.
For VPC Flow Logs, Athena turns raw traffic data into structured insights, making it much easier to explore and investigate.
What is Amazon QuickSight?
Amazon QuickSight is a fully managed business intelligence (BI) service that allows you to create interactive visualizations and dashboards. It connects directly to Athena, so you can transform your SQL query results into charts, graphs, and reports.
Prerequisites
Before you start, make sure you have the following in place:
- AWS Account An active AWS account with access to the AWS Management Console.
- VPC An existing Virtual Private Cloud (VPC) where you will enable Flow Logs.
Step 1: Enable VPC Flow Logs
To capture traffic activity inside your VPC, you first need to create a VPC Flow Log and deliver the data to Amazon S3.
Enable Flow Logs via the Console
- Open the VPC Console and select Your VPCs.
- Choose the VPC you want to monitor and go to the Flow Logs tab.
- Click Create Flow Log.
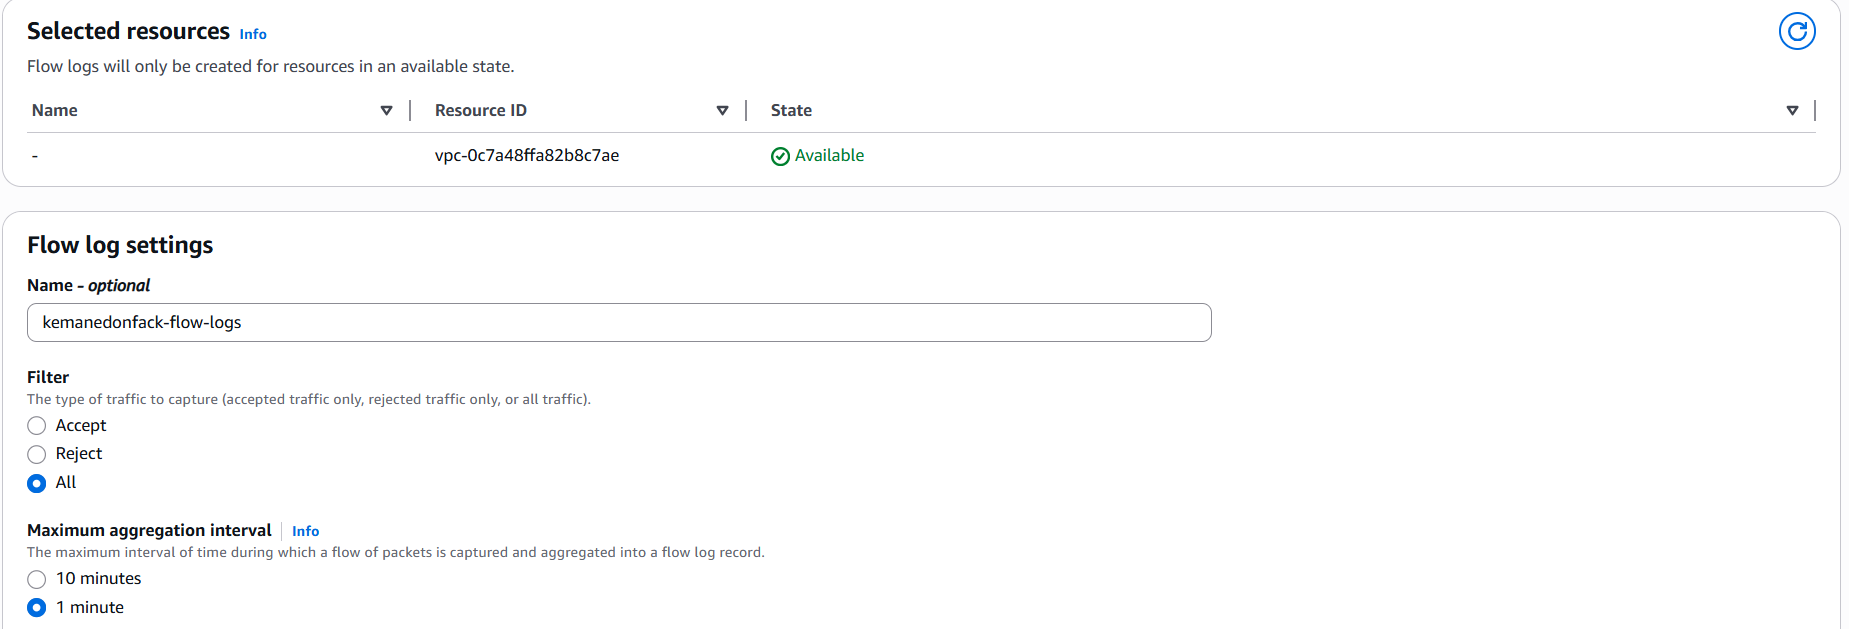
- Name Enter a descriptive name for your flow log.
- Traffic type Choose what traffic to capture:
ALL→ Captures accepted and rejected traffic (recommended for full visibility).
-
Maximum aggregation interval Choose how often logs are aggregated before delivery:
1 minute→ Higher granularity, more detail, higher cost.10 minutes→ Lower granularity, fewer records, lower cost (recommended for most cases).
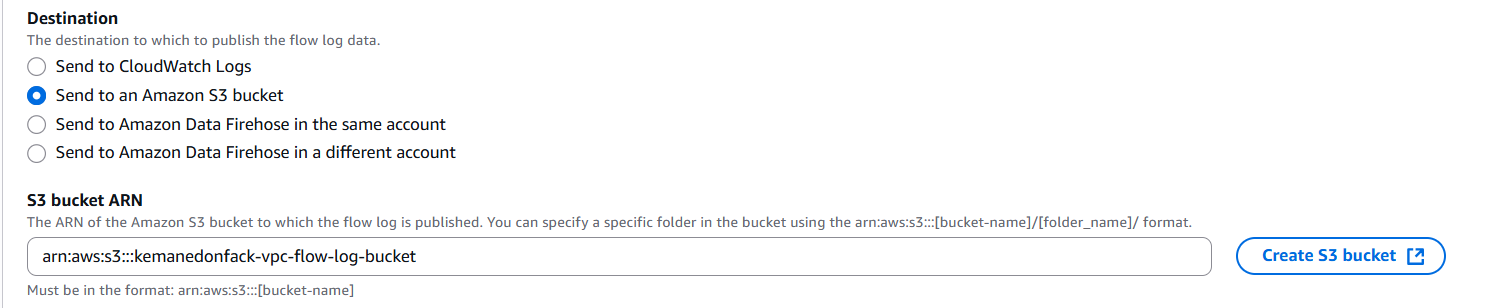
- Destination type Select Send to S3 bucket.
- S3 bucket ARN Provide the ARN of your bucket (e.g.,
arn:aws:s3:::my-vpc-flow-logs-bucket).
- Log format Keep the default format.
- Review the configuration and click Create Flow Log.
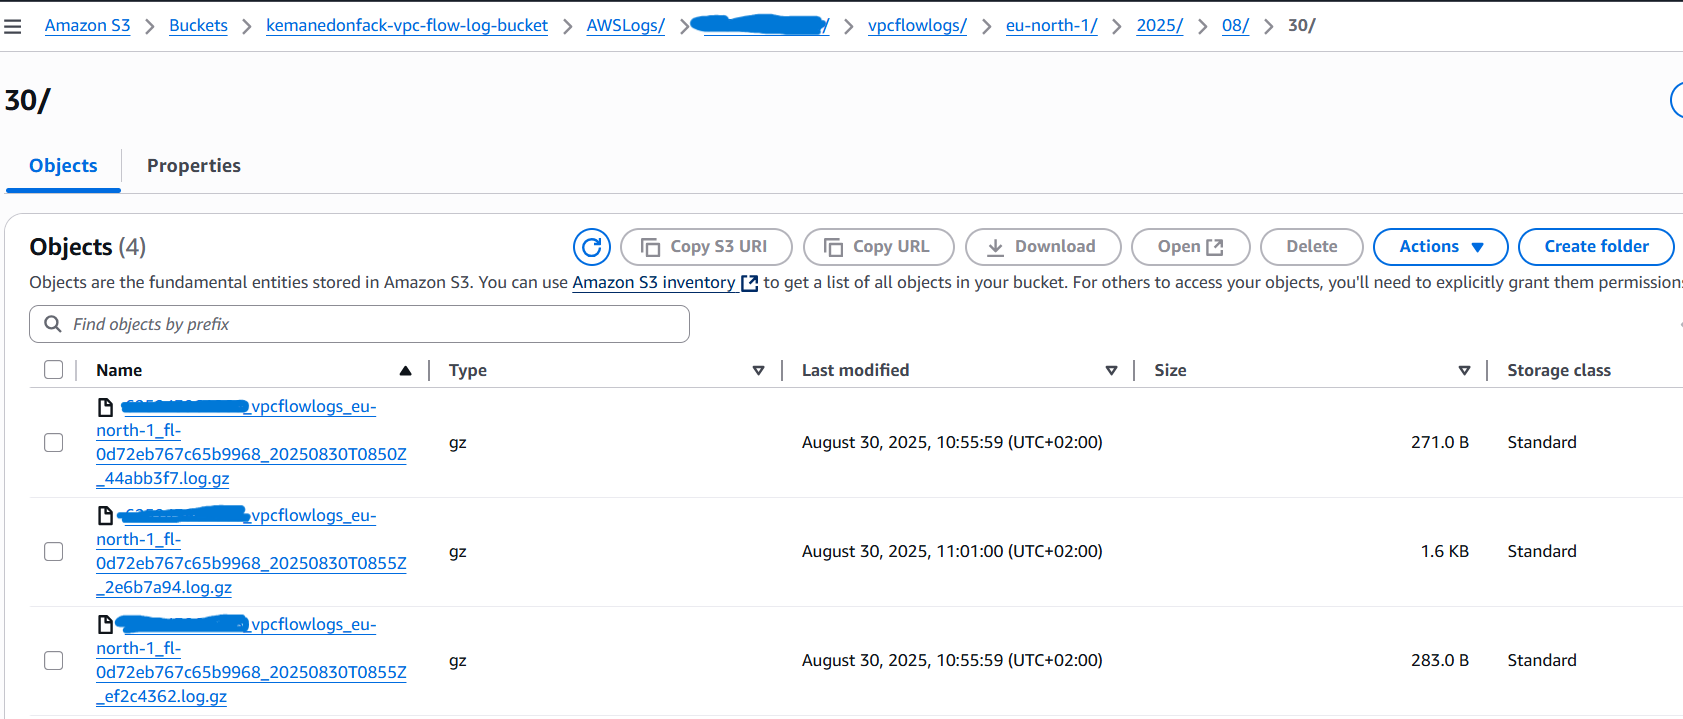
Once created, your flow logs will start streaming into the S3 bucket under the chosen prefix. You can verify delivery by checking the bucket for newly created log files.
Step 2: Prepare Data in Athena
With your VPC Flow Logs now stored in Amazon S3, the next step is to make them queryable using Amazon Athena. Athena can query structured data directly from S3 once you define a table schema.
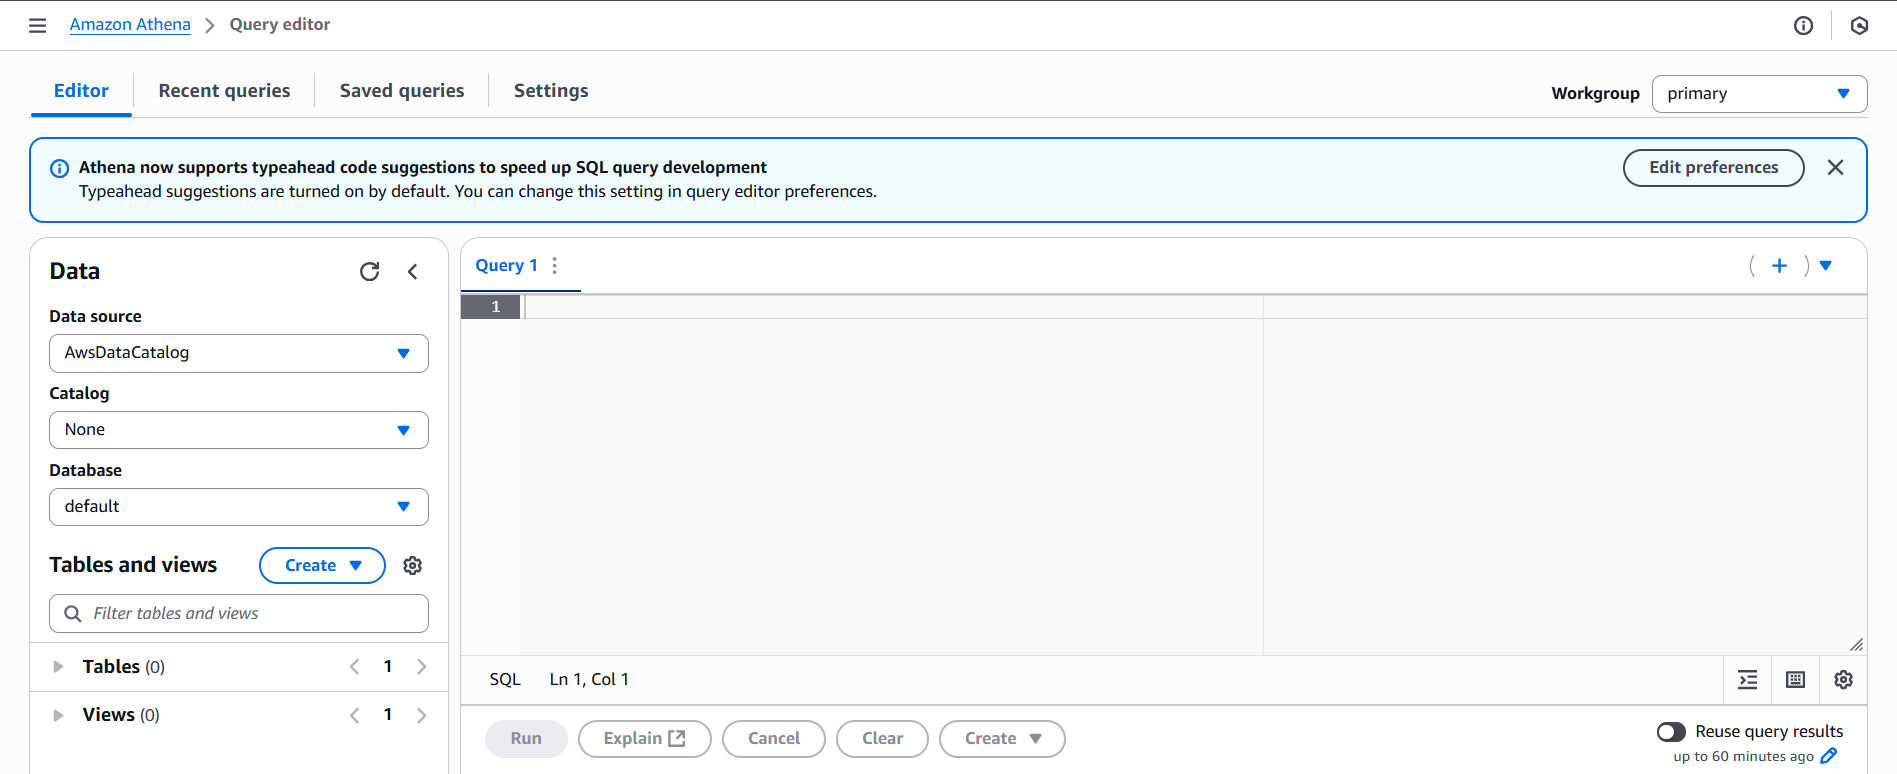
Create the Athena Table
Open the Athena Console, select your database, and run the following CREATE EXTERNAL TABLE statement. Be sure to update the S3 path with the location of your logs:
CREATE EXTERNAL TABLE IF NOT EXISTS `vpc_flow_logs` (
  version int,
  account_id string,
  interface_id string,
  srcaddr string,
  dstaddr string,
  srcport int,
  dstport int,
  protocol bigint,
  packets bigint,
  bytes bigint,
  start bigint,
  `end` bigint,
  action string,
  log_status string,
  vpc_id string,
  subnet_id string,
  instance_id string,
  tcp_flags int,
  type string,
  pkt_srcaddr string,
  pkt_dstaddr string,
  region string,
  az_id string,
  sublocation_type string,
  sublocation_id string,
  pkt_src_aws_service string,
  pkt_dst_aws_service string,
  flow_direction string,
  traffic_path int
)
PARTITIONED BY (`date` date)
ROW FORMAT DELIMITED
FIELDS TERMINATED BY ' '
LOCATION 's3://kemanedonfack-vpc-flow-log-bucket/AWSLogs/xxxxxx/vpcflowlogs/eu-north-1/'
TBLPROPERTIES ("skip.header.line.count"="1");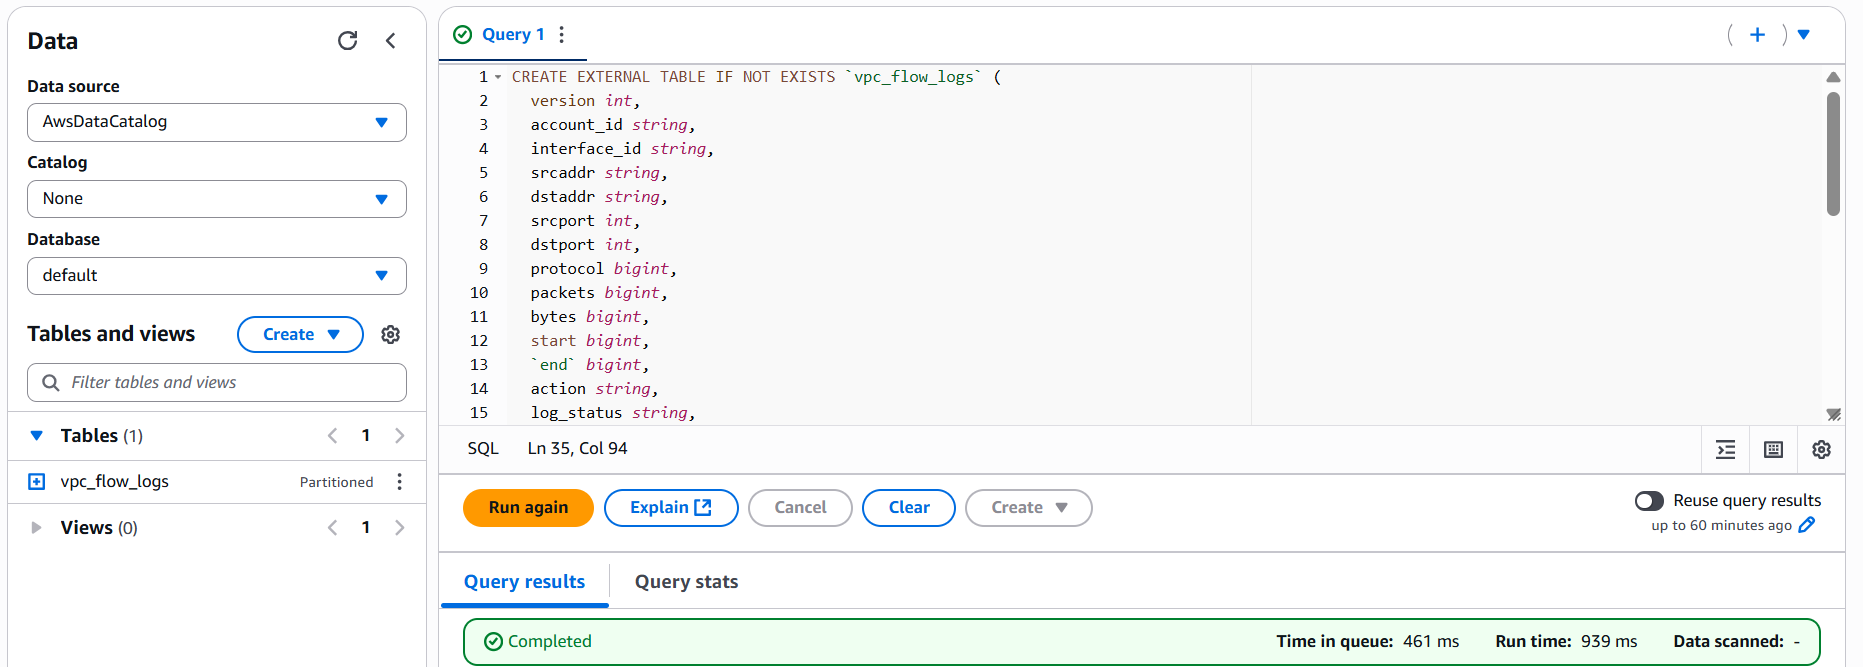
Add Partitions
If you use partitioned storage, you need to load the partitions into Athena.
ALTER TABLE vpc_flow_logs
ADD PARTITION (`date`='2025-08-30')
LOCATION 's3://kemanedonfack-vpc-flow-log-bucket/AWSLogs/xxxxxx/vpcflowlogs/eu-north-1/2025/08/30/';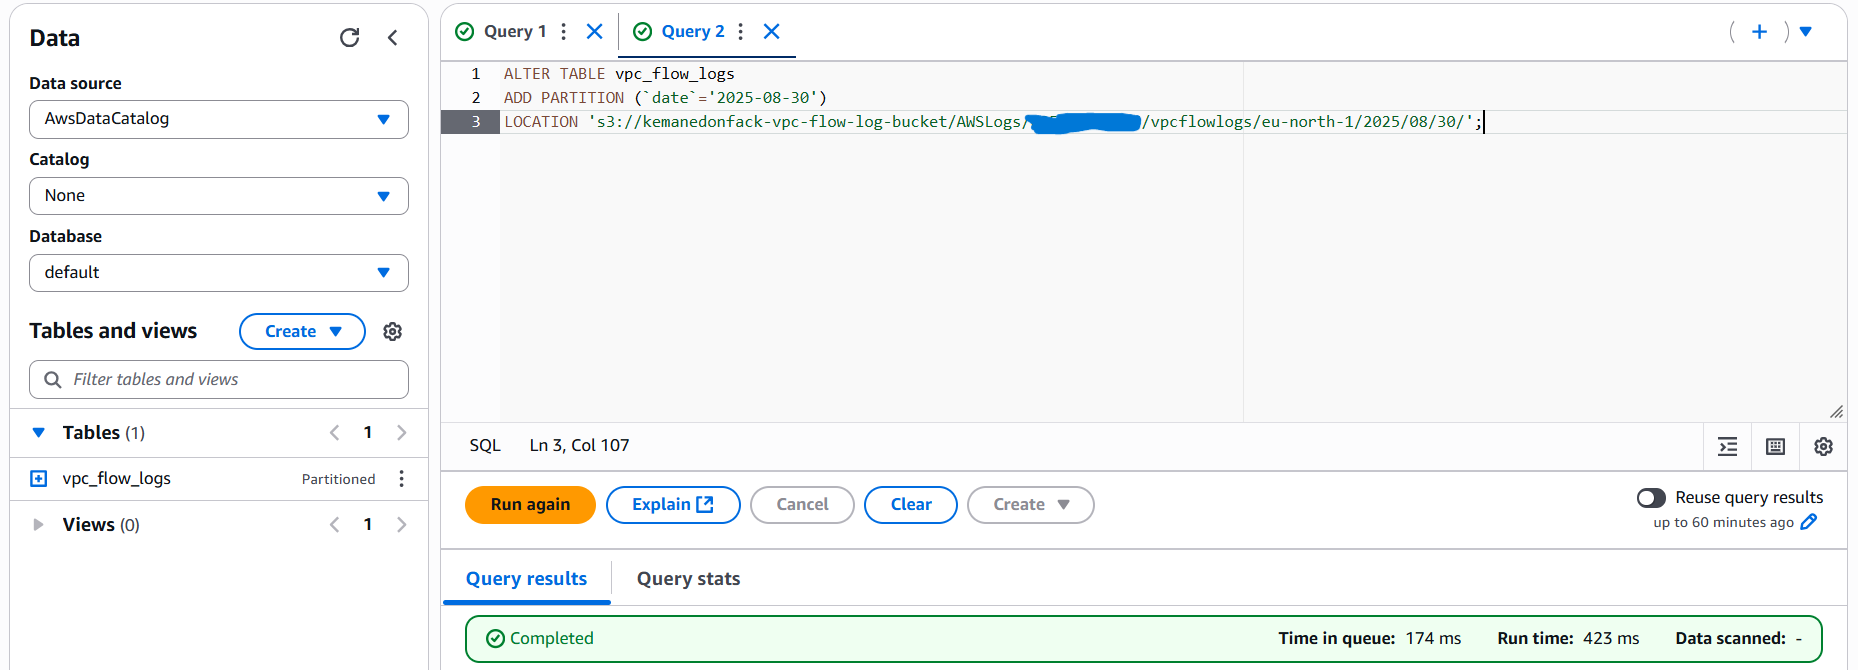
Validate the Table
Run a simple query to confirm that Athena can read the data:
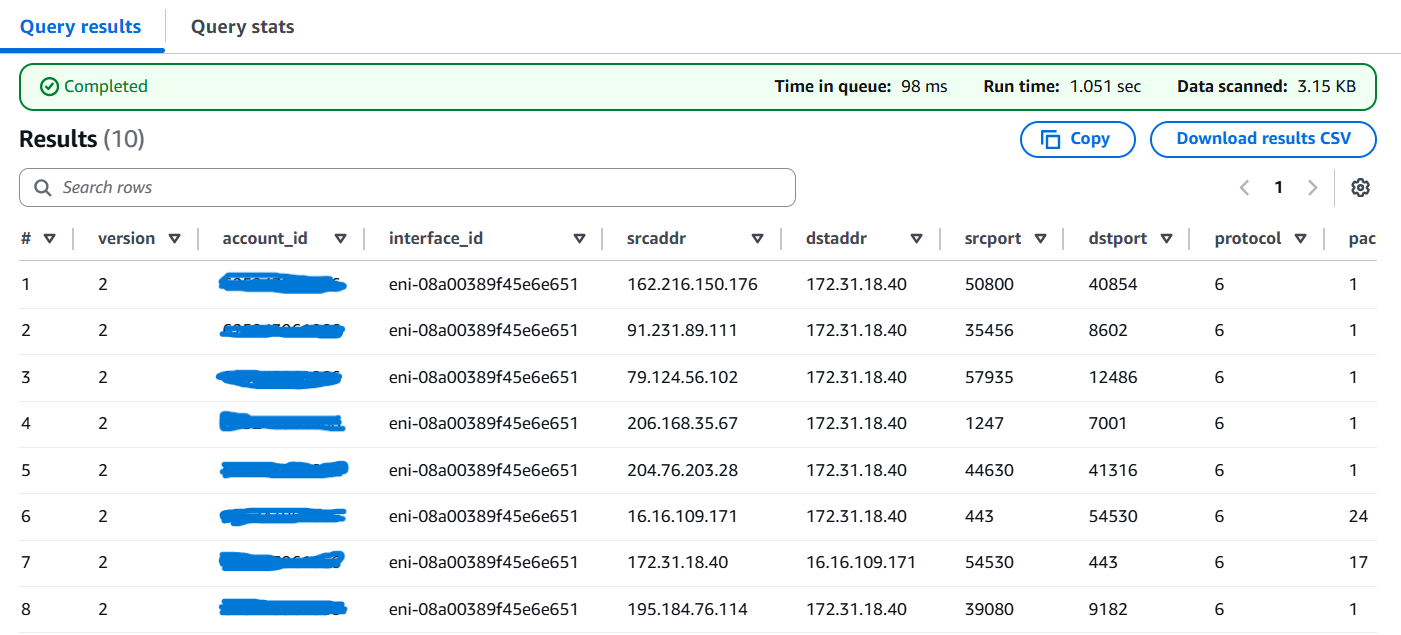
SELECT *
FROM vpc_flow_logs
LIMIT 10;
You should now see traffic records with fields such as srcaddr, dstaddr, action, and bytes.
Step 3: Run Queries with Athena
Now that your VPC Flow Logs are available in Athena, you can start exploring the data with SQL. Below are some example queries to uncover valuable insights about your network traffic.
Top Source IPs
This query shows the IP addresses generating the most traffic in terms of bytes:
SELECT srcaddr, SUM(bytes) AS total_bytes
FROM vpc_flow_logs
WHERE action = 'ACCEPT'
GROUP BY srcaddr
ORDER BY total_bytes DESC
LIMIT 10;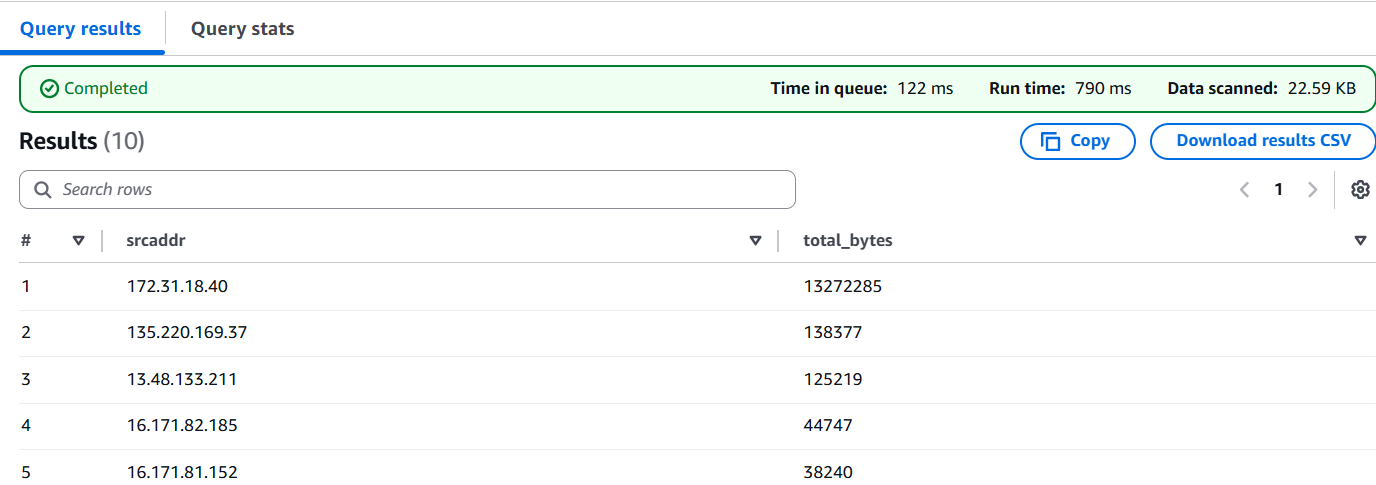
Top Destination IPs
Find out which destination IPs are receiving the most traffic:
SELECT dstaddr, SUM(bytes) AS total_bytes
FROM vpc_flow_logs
WHERE action = 'ACCEPT'
GROUP BY dstaddr
ORDER BY total_bytes DESC
LIMIT 10;
Most Used Ports and Protocols
To understand which ports are most active:
SELECT dstport, COUNT(*) AS connection_count
FROM vpc_flow_logs
WHERE action = 'ACCEPT'
GROUP BY dstport
ORDER BY connection_count DESC
LIMIT 10;
To check protocol distribution (e.g., TCP=6, UDP=17, ICMP=1):
SELECT protocol, COUNT(*) AS connection_count
FROM vpc_flow_logs
GROUP BY protocol
ORDER BY connection_count DESC;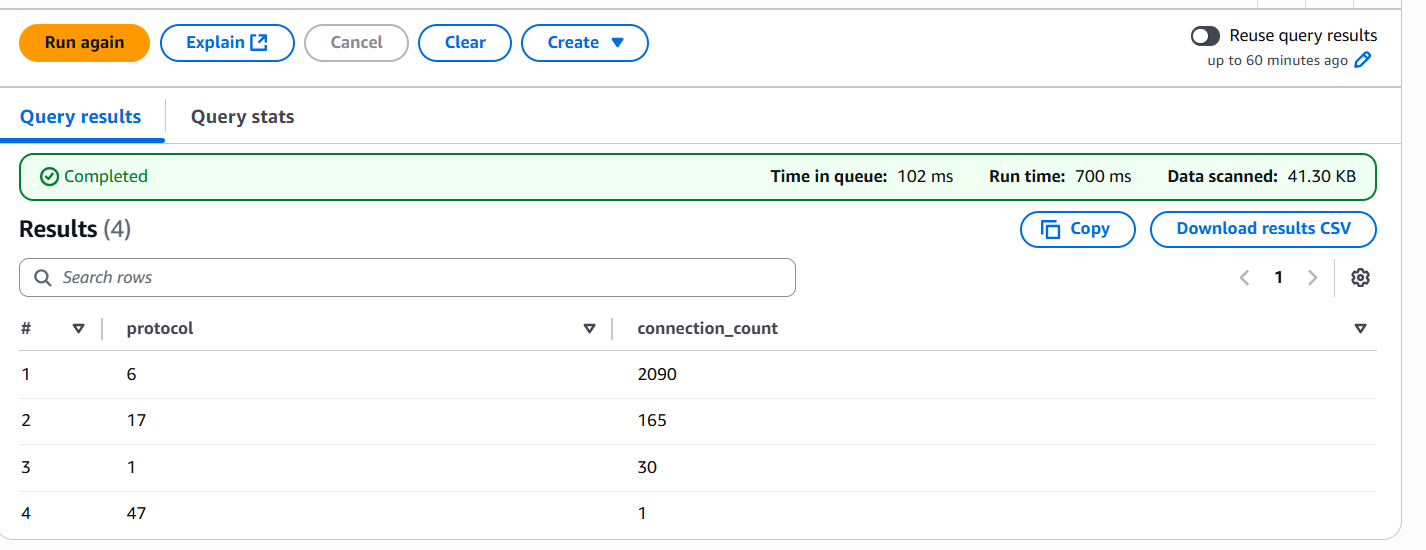
Accepted vs Rejected Traffic
Quickly compare how much traffic is accepted versus rejected:
SELECT action, COUNT(*) AS request_count, SUM(bytes) AS total_bytes
FROM vpc_flow_logs
GROUP BY action;
This helps detect if there are unusual spikes in REJECTED traffic.
Bandwidth by Subnet or VPC
If your flow logs include subnet IDs or VPC IDs, you can aggregate traffic at that level. Example by subnet:
SELECT interface_id, SUM(bytes) AS total_bytes
FROM vpc_flow_logs
GROUP BY interface_id
ORDER BY total_bytes DESC;
This gives visibility into which subnets or ENIs (Elastic Network Interfaces) are consuming the most bandwidth.
Step 4: Connect Athena to QuickSight
Once you’ve run queries in Athena, the next step is to visualize the results with Amazon QuickSight. To do this, you need to connect Athena as a data source and configure the right permissions.
Configure IAM and QuickSight Permissions
To allow QuickSight to query Athena and read data from S3:
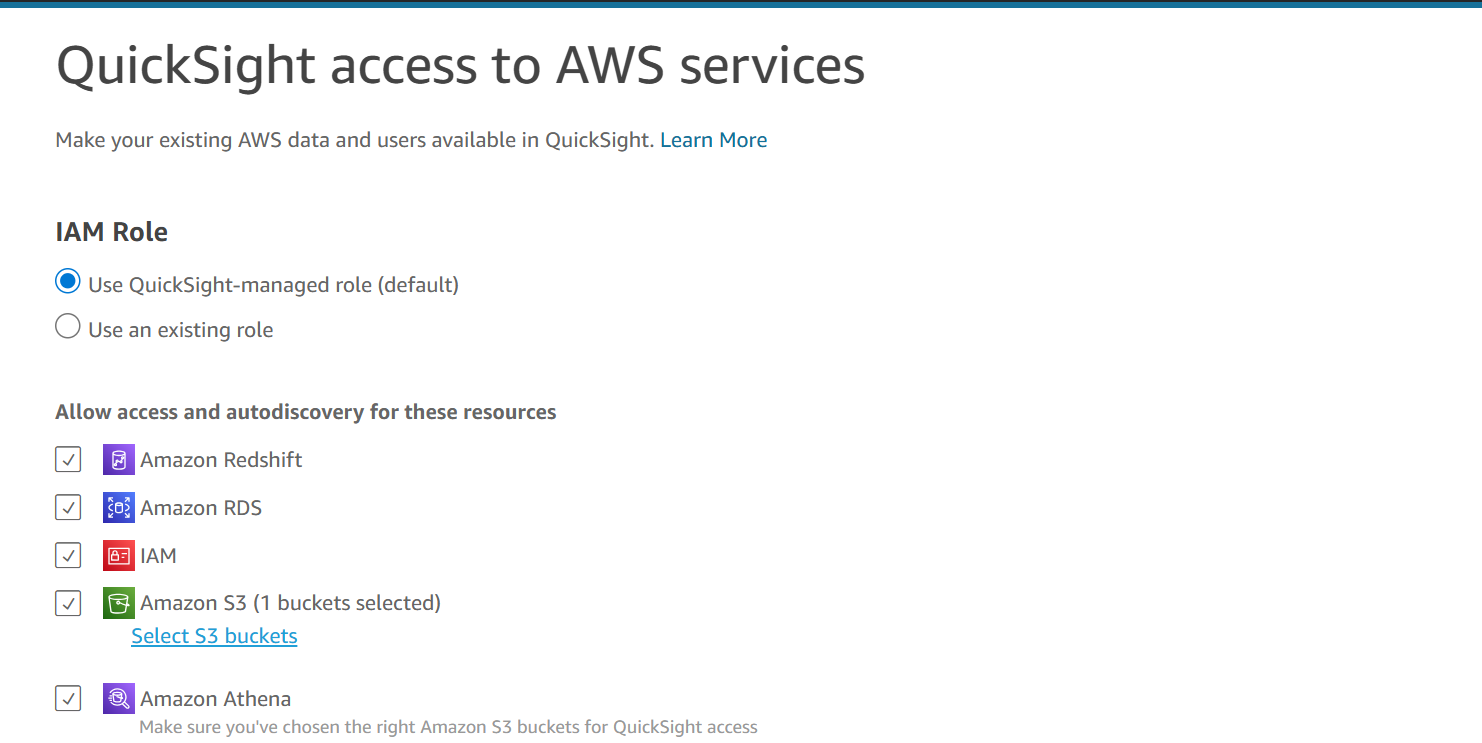
- In the QuickSight Console, go to Manage QuickSight → Security & permissions.
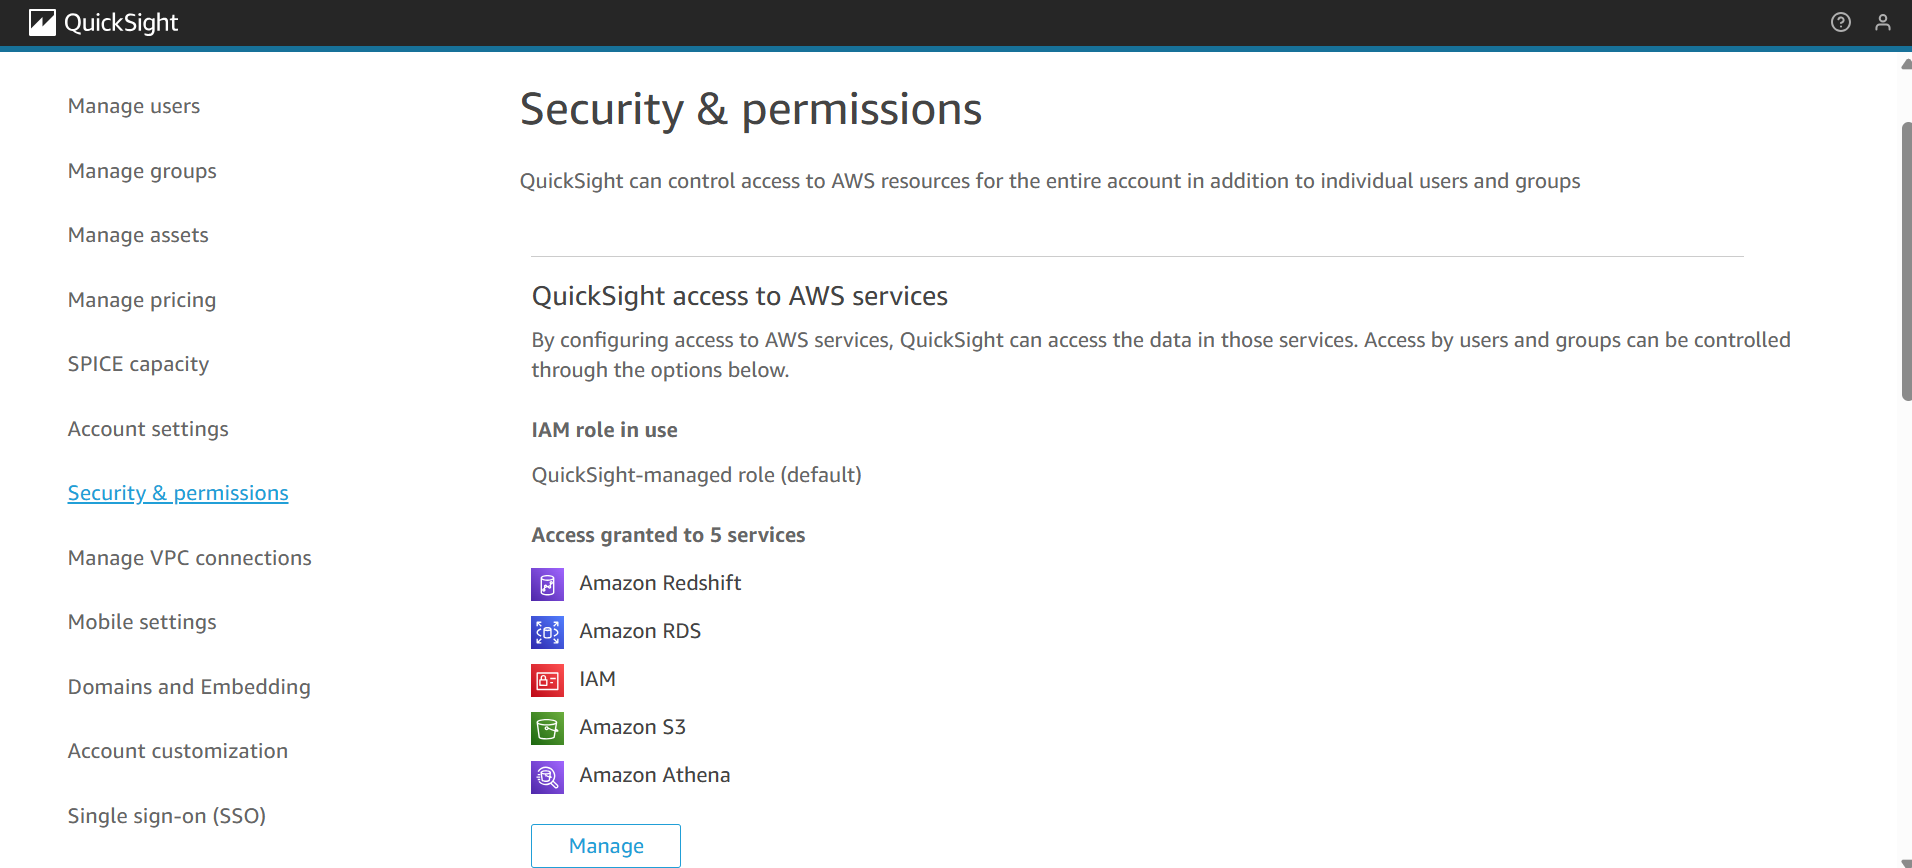
-
Ensure that QuickSight has access to:
- Athena to run queries.
- Amazon S3 specifically the bucket(s) where VPC Flow Logs are stored and the Athena query results bucket.
-
Attach the managed policy
AmazonAthenaFullAccessand grant S3 read access via the IAM role associated with QuickSight.
Add Athena as a Data Source
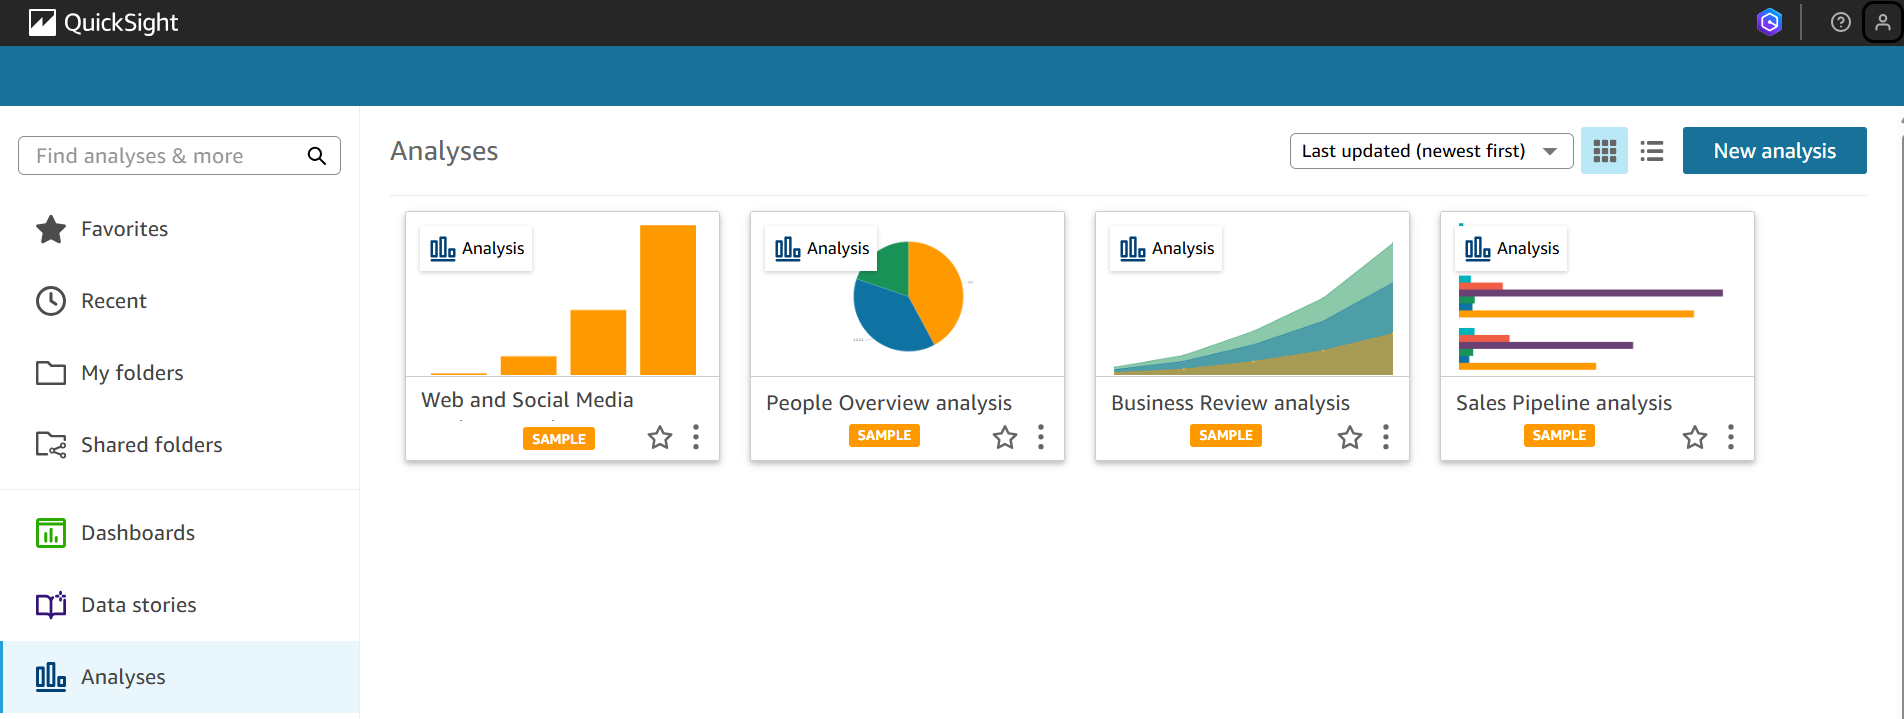
- Open the Amazon QuickSight Console.
- Go to Datasets → New dataset.
- Select Athena as the data source.
- Give your data source a name (e.g.,
VPCFlowLogsAthena).
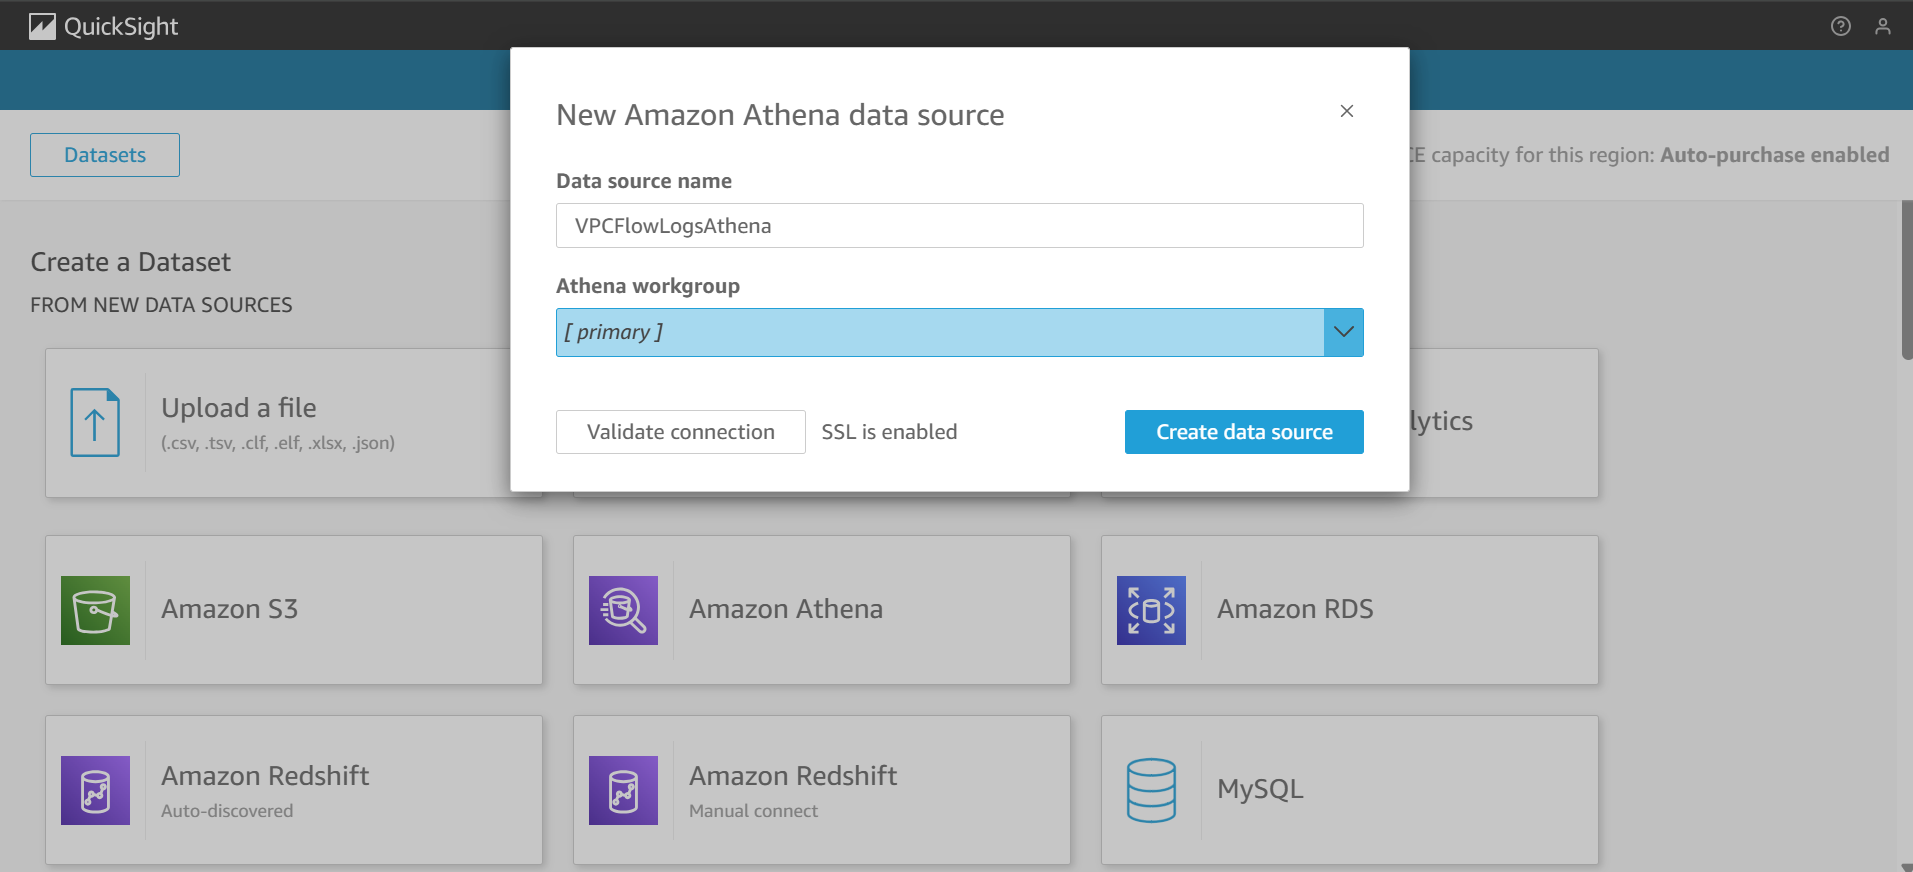
- Choose the correct Athena workgroup and click Create data source.
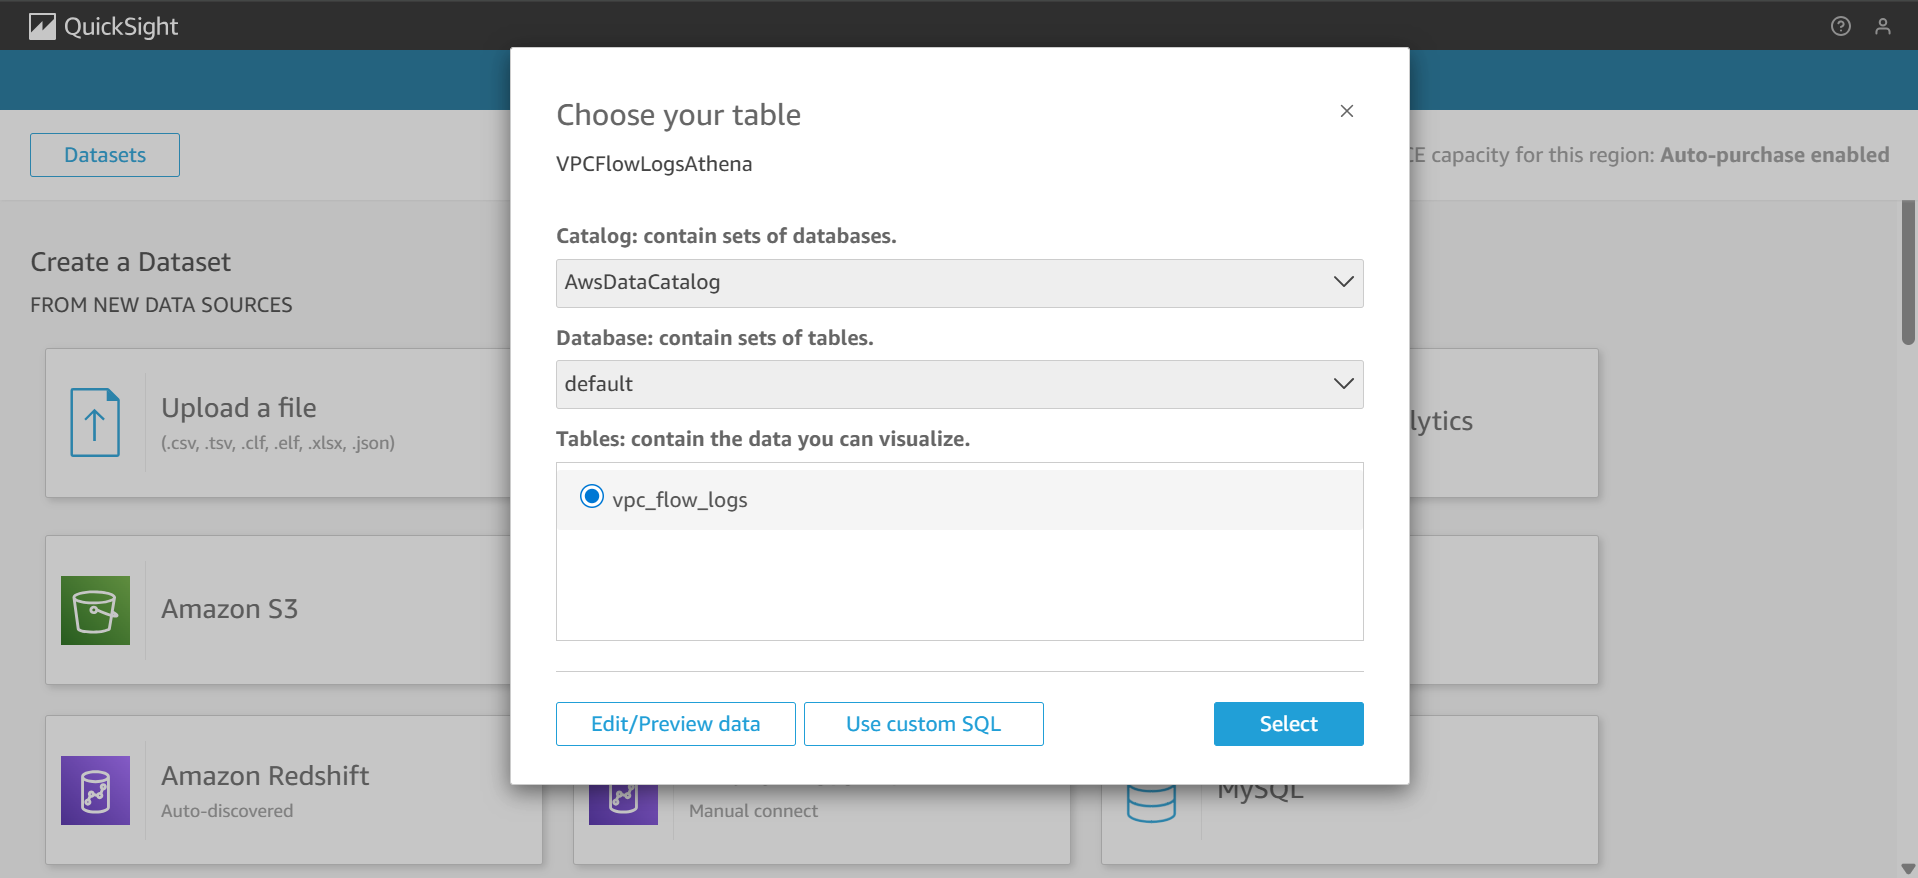
- Select the database and the
vpc_flow_logstable you created earlier in Athena.
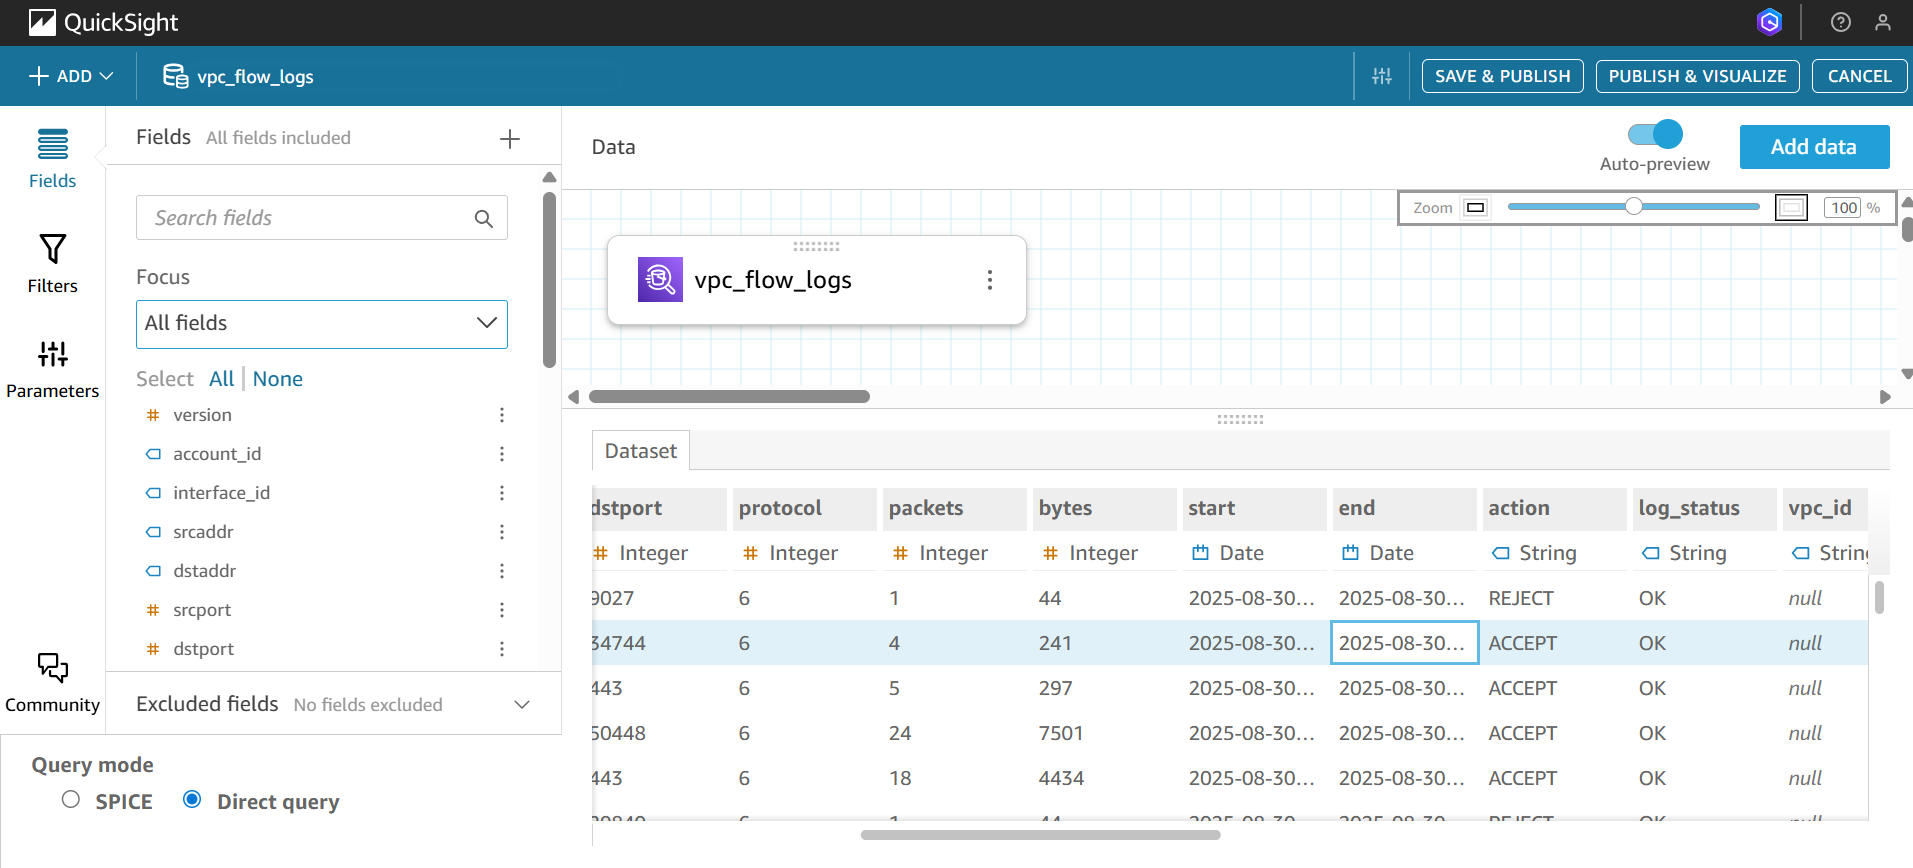
- Choose Edit/Preview data. For start_time and end_time, set the data format as a date rather than a number.
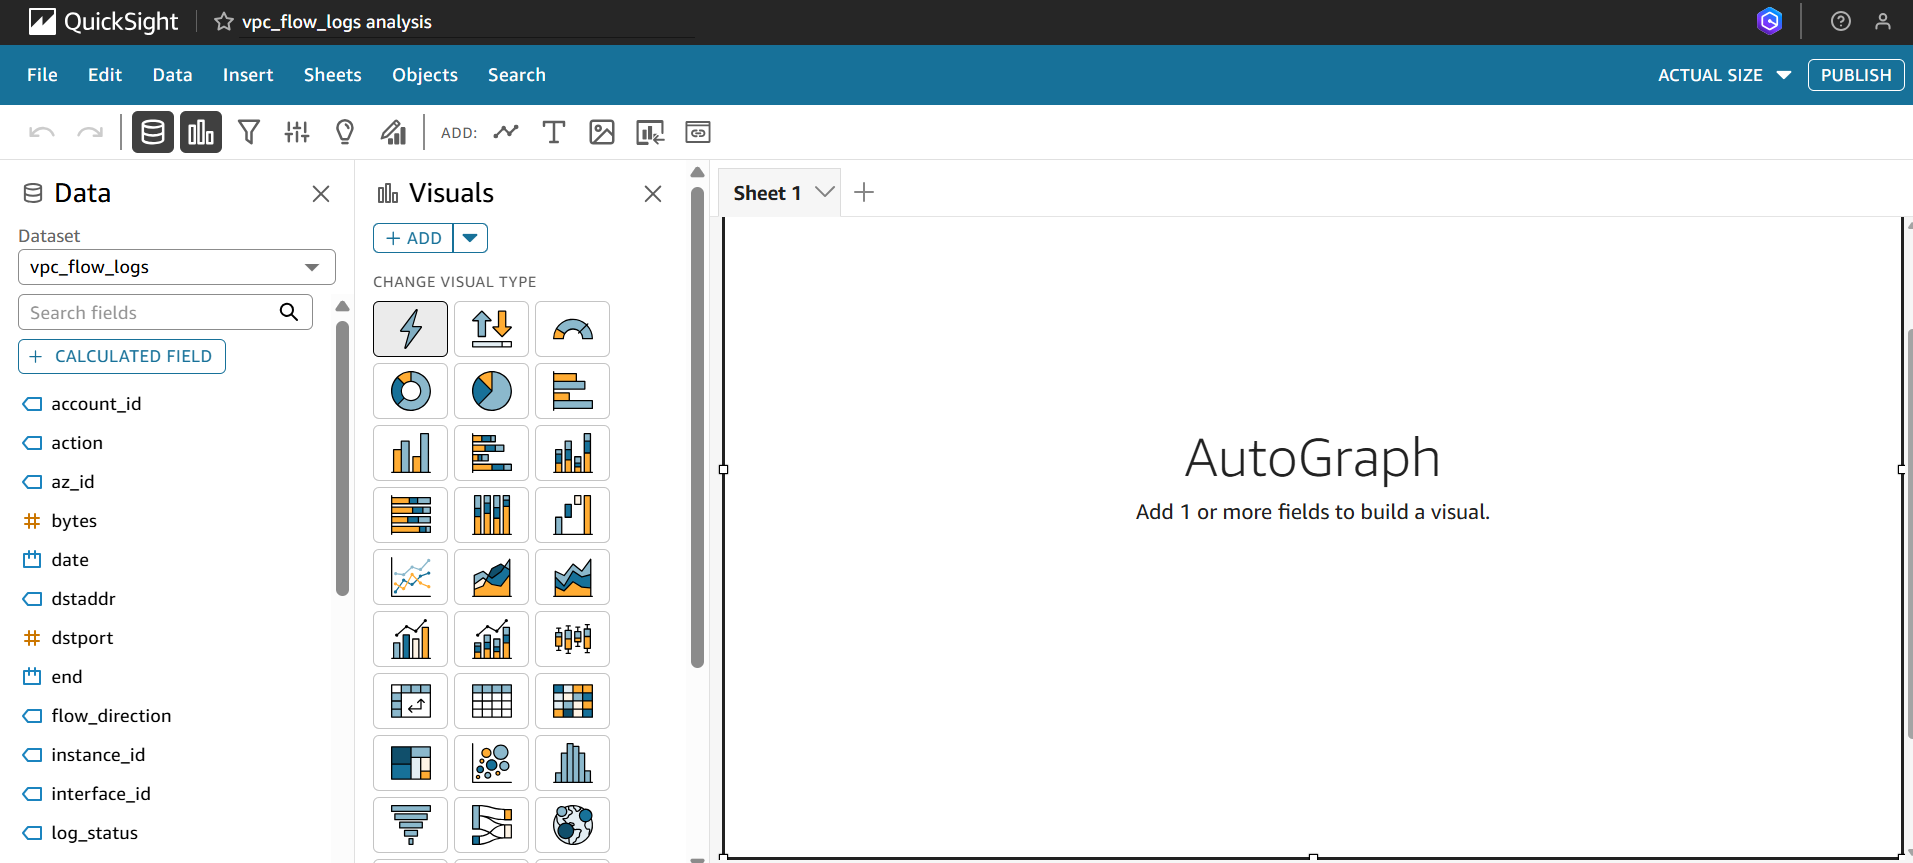
- Now select Save and visualize.
Step 5: Build Visualizations in QuickSight
With your dataset connected, you can now create interactive dashboards to better understand traffic patterns. QuickSight provides different chart types that map perfectly to VPC Flow Log insights. Below are some examples you can build:
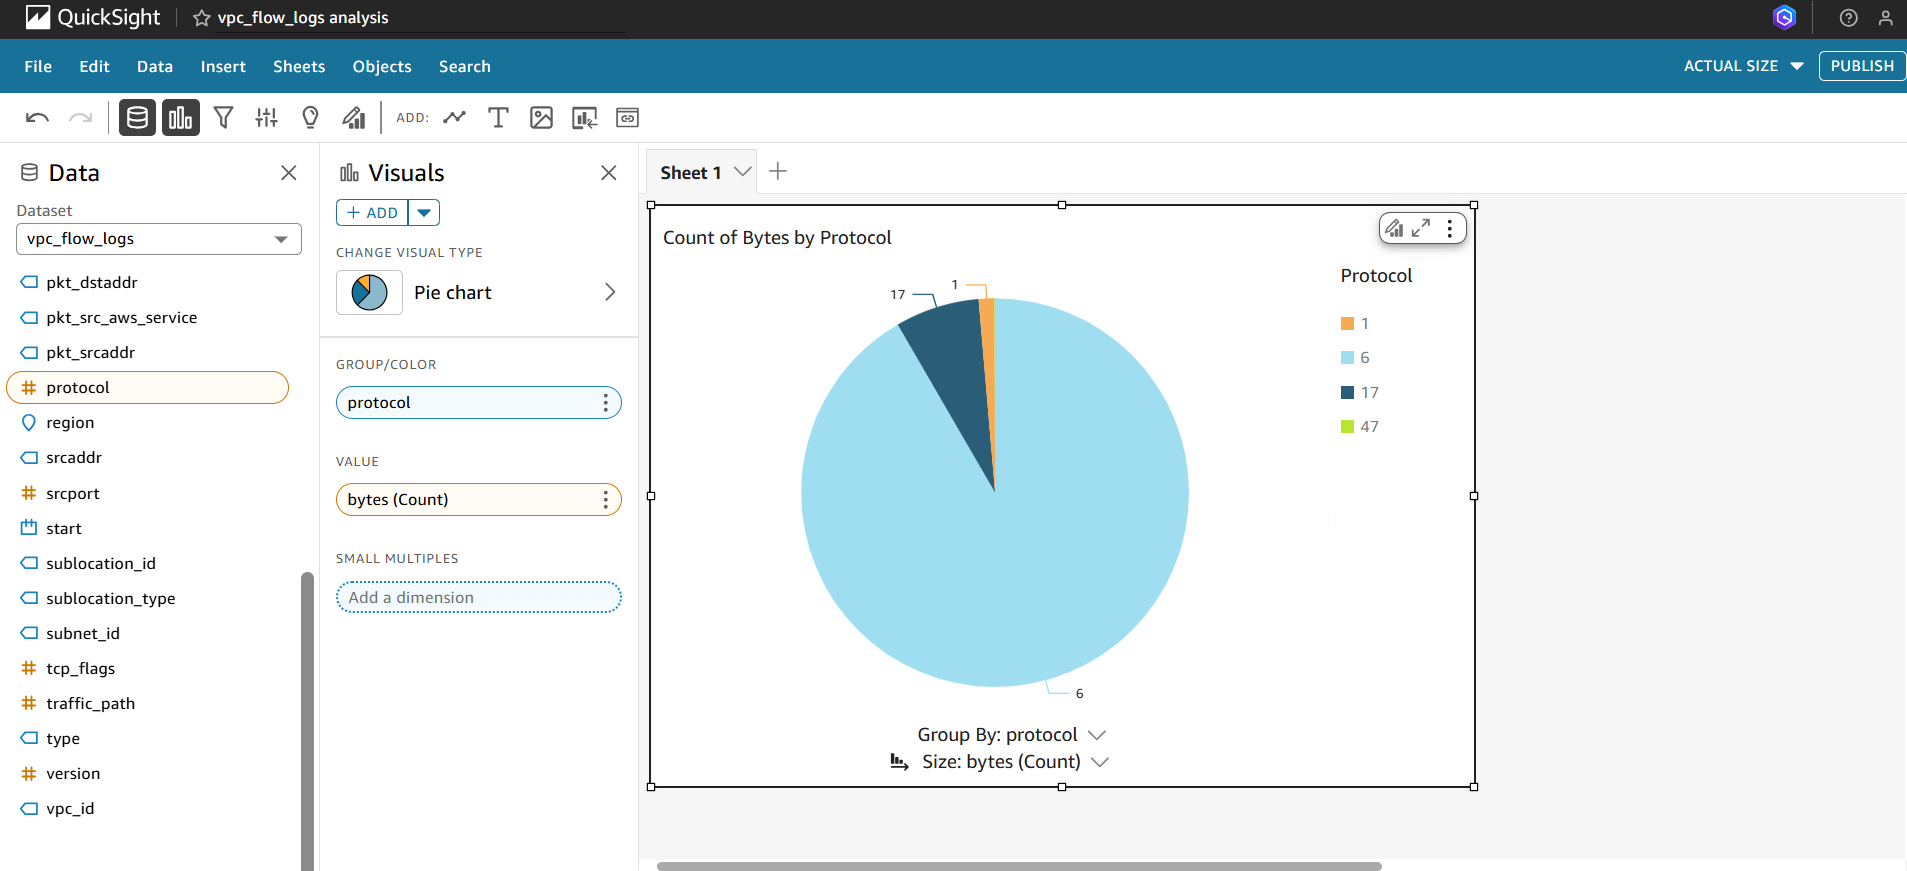
Pie Chart – Traffic by Protocol
- Goal: Quickly see which protocols (TCP, UDP, ICMP, etc.) dominate traffic.
-
How to build:
- Select Pie chart as the visualization type.
- Use
protocolas the Group by field. - Use
COUNT(*)orSUM(bytes)as the metric.
This makes it easy to spot protocol usage distribution across your VPC.
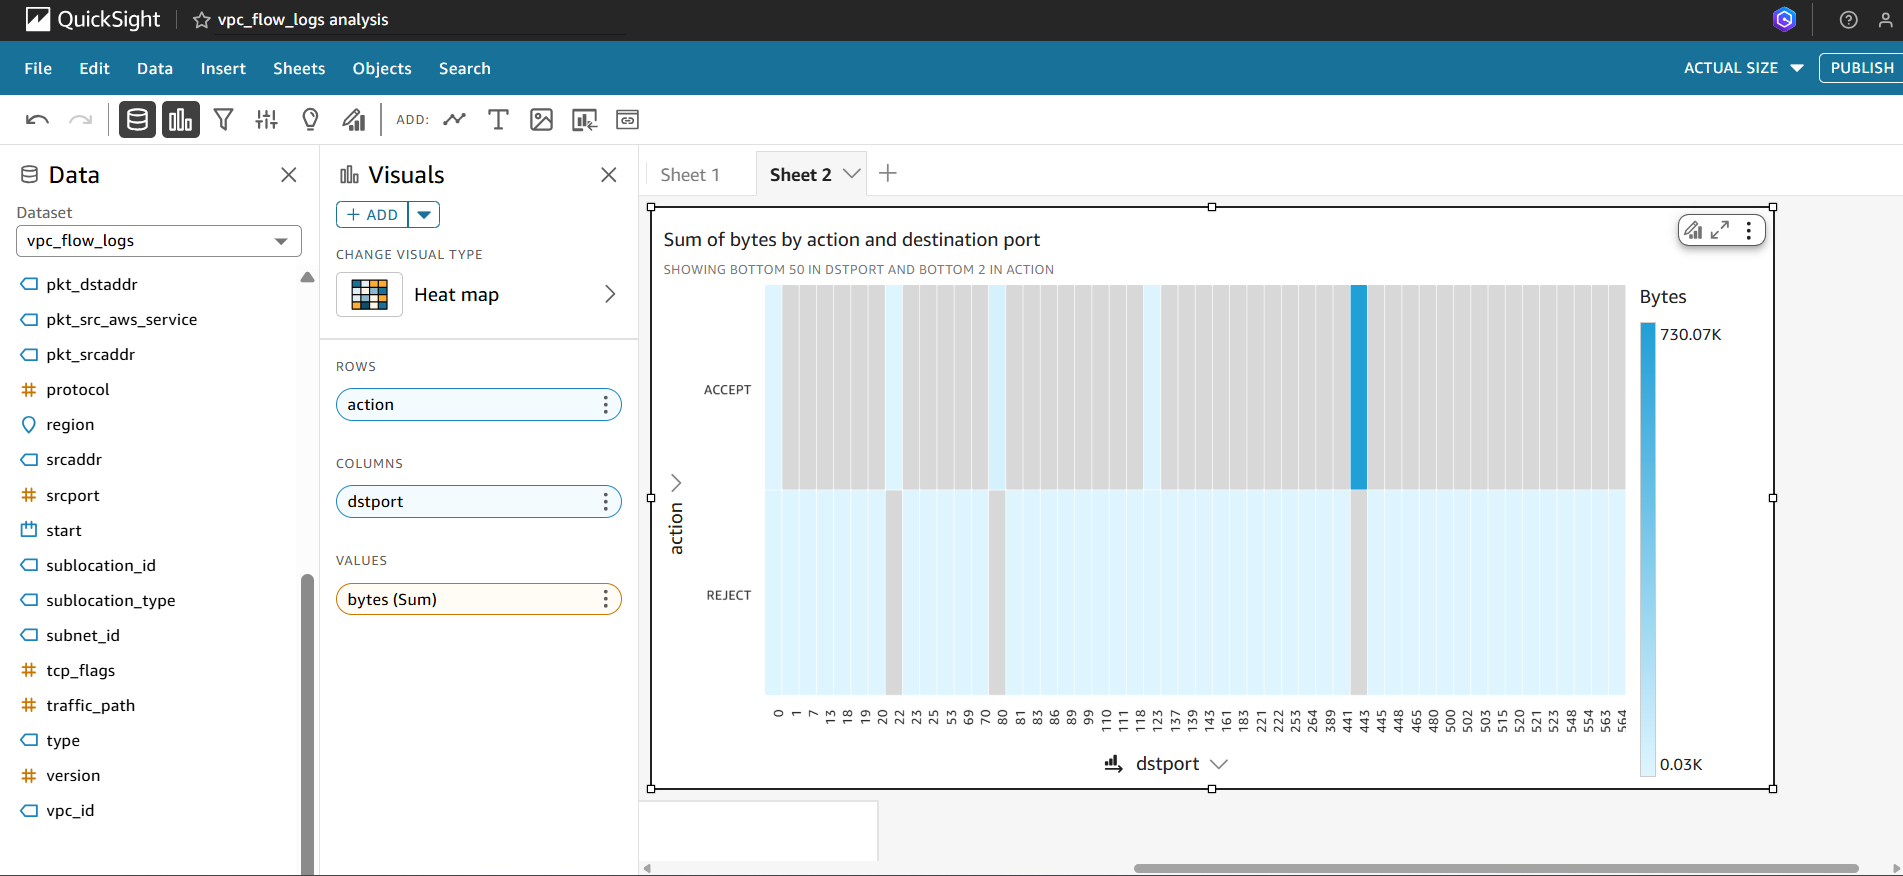
Heatmap – Accepted vs Rejected Traffic
- Goal: Compare network traffic decisions (ACCEPT vs REJECT) across ports or IPs.
-
How to build:
- Choose a Heatmap visualization.
- Place
action(ACCEPT/REJECT) on one axis. - Place another dimension such as
dstportorsrcaddron the other axis. - Use
COUNT(*)orSUM(bytes)as the metric for color intensity.
This visualization helps identify blocked attempts, security anomalies, or misconfigured security groups/NACLs.
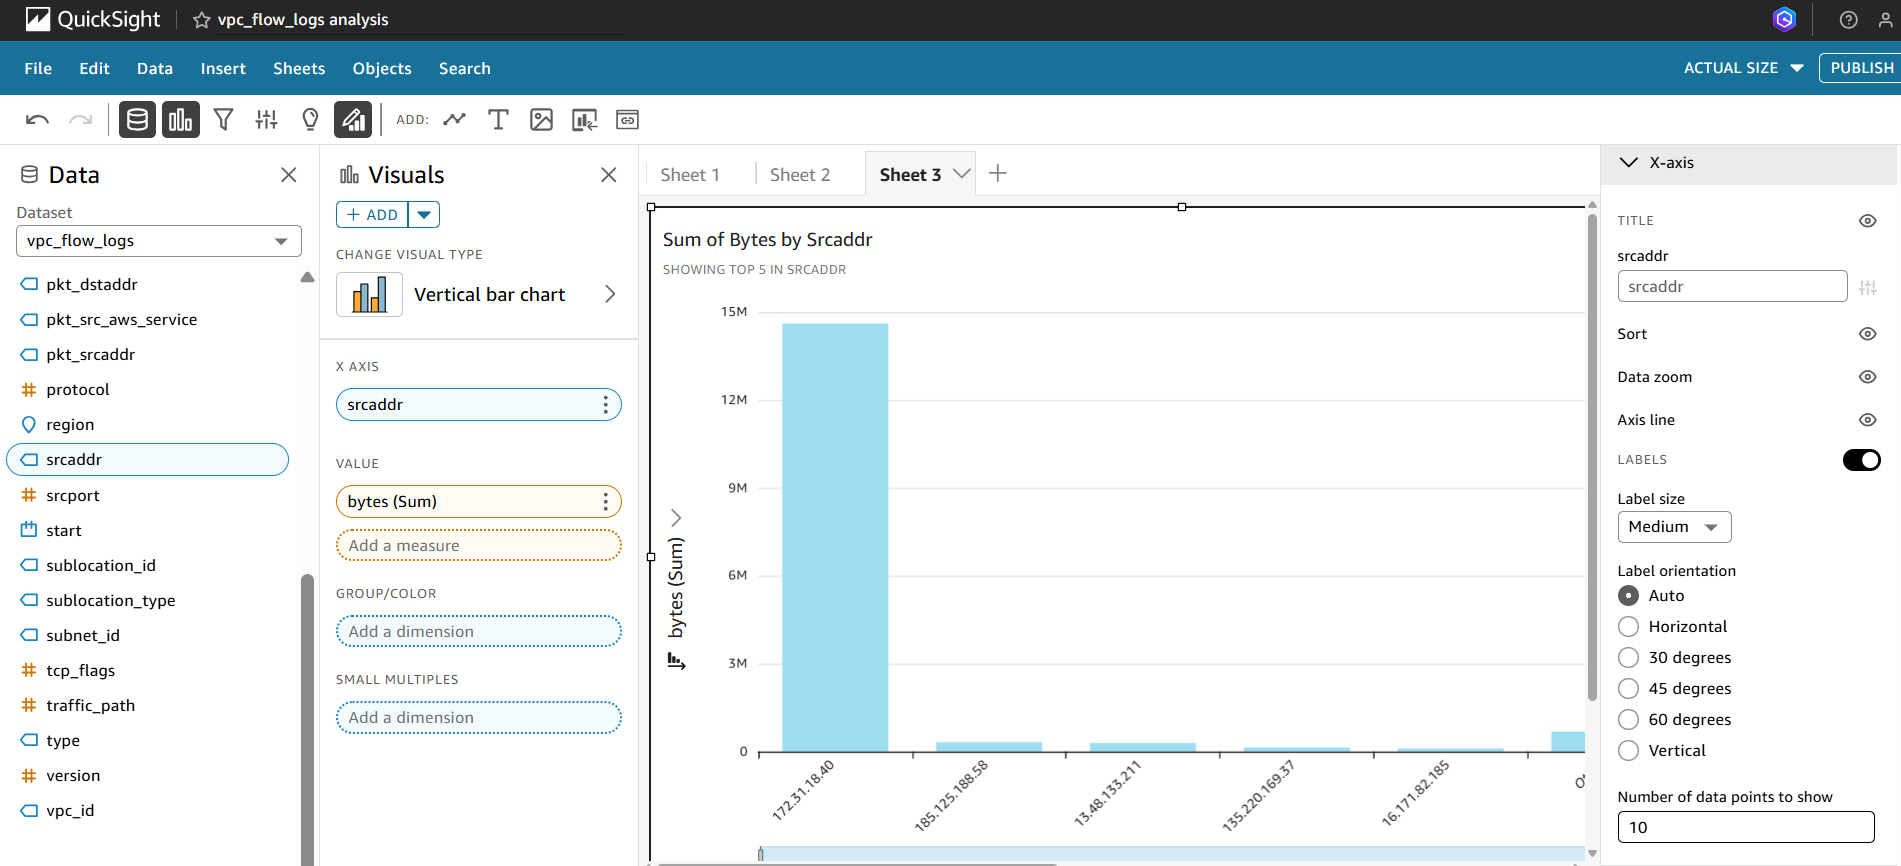
Bar Chart – Top Talkers (Source IPs)
- Goal: Identify which source IPs generate the most traffic.
-
How to build:
- Choose a Bar chart visualization.
- Set
srcaddras the X-axis (Group by). - Set
SUM(bytes)as the Y-axis (Value). - Sort the results by descending traffic volume and limit to the top 10.
Conclusion
Converting VPC Flow Logs into queryable datasets with Amazon Athena and visual dashboards in QuickSight delivers practical network visibility for security, troubleshooting, and cost control. Apply core best practices partition and compress logs, enforce least-privilege IAM, and secure S3 storage to keep queries efficient and data protected. This approach makes it easier to detect anomalies, investigate incidents, and maintain reliable operational insight from your VPC traffic.
Leave a Reply